Sunday, March 31, 2013

Prehospital Serial ECGs demonstrate repeated Reperfusion and Reocclusion

A 78 yo male had a syncopal event and complained of chest pain.

Here are 9 prehospital ECGs during transport:

0 minutes, nondiagnostic
4 minutes, inferior STEMI (subtle).
5 minutes, reperfused, barely shows on the ECG
7 minutes, almost normal again.
15 minutes, more obvious


16 minutes, more obvious, NTG given here

22 min, with V4R, STE gone after NTG and Aspirin


23 minutes, very subtle, resolving

29 minutes, almost entirely resolved


The cath lab was activated prehospital and the patient received an RCA stent and an LAD stent, had a minimal troponin rise, and did well.

This shows how acute coronary syndrome is very dynamic, with arteries opening and closing.  Studies using continuous 12-lead monitoring show that this happens even in the abscence of chest pain.

Wednesday, March 27, 2013

Acute Severe Pulmonary Edema: What is the Diagnosis?

Here is an interesting case just presented in a conference today.  Thanks to Dr. Simegn, Asinger, Davies, and Bart for their input.

A 69 yo previously healthy woman had very sudden severe dyspnea.  The husband at some point reported that they had been physically active that day, and that the patient had complained of some chest pain one week prior for which she did not take his advice to go to the ER.  She presented in pulmonary edema, hypoxic on high flow O2, and sats were above 90% on Noninvasive Ventilation.  BP was 130/70.  Cardiac physical exam was unremarkable except for very coarse breath sounds. ABG was 6.99/44/201/11 on BiPAP.  Here is her first ECG:
The rate is 143.  There are p-waves, but in lead II there are apparently 2 p-waves for every QRS.   Is it atrial flutter?  The second apparent p-wave comes immediately after the QRS and appears to simulate ST elevation (Atrial flutter can frequently mimic ST deviation).   
However, if you measure these with calipers, they are not exactly spaced, so it cannot be be atrial flutter. 
There are also inferior Q-waves with T-wave inversion.   (In fact, there is S1Q3T3).  There is precordial ST depression which could represent subendocardial ischemia from severe tachycardia, hypoxia, etc, or it could be due to inferior posterior STEMI.


What else will help you to confirm that this is not atrial flutter, but rather is sinus tachycardia?  This is also important because there are notches after the QRS in the limb leads which, if not atrial flutter waves, are ST segment deviation.  Is this patient having a STEMI?

The ST segment and QT interval are remarkably short and could easily deceive you into thinking that this is not ST elevation, but rather flutter waves.

Considerations include:
1. Lead V1.  In sinus rhythm, the latter part of the p-wave in V1 is always negative, as it represents the depolorization of the left atrium, which is depolarizing away from lead V1.  In atrial flutter, the p-wave in V1 is usually upright.  Here it looks like a normal p-wave.  Furthermore, you don't see an identical wave directly between the p-waves and given that the baseline is pretty steady, it should be there.
2. If flutter, the rate should remain constant in spite of supportive care.

Now that we have established that the rhythm is sinus.  

A right sided ECG was recorded 6 minutes later:
The rate is still exactly 143.  Are we sure it is sinus tachycardia?


A bedside echo showed hyperdynamic function and a large RV.  The chest X-ray showed pulmonary edema.  The patient's respiratory status deteriorated and she was intubated.

Step back: what caused sudden respiratory failure with pulmonary edema?
--Does acute inferior-posterior STEMI alone do this?  Not if the pump function is hyperdynamic.
--Does atrial flutter alone cause severe pulmonary edema in someone who was previously healthy?  No.  (However, if this is atrial flutter, it is wise to cardiovert and this can only help the situation.  This was not done.  It appears that the rhythm diagnosis of atrial flutter was not considered.  If it is sinus, cardioversion will not hurt.)
--Does massive pulmonary embolism cause pulmonary edema?  Rarely, if ever.

A CT pulmonary angiogram was negative.

What test is now indicated?  What is the likely diagnosis?

Another ECG was recorded:
Now the rate is down to 120 and it is clearly sinus.  The p-waves are identical to those in the first ECG.  So those, too, were sinus.  Which means the waves after the QRS were indeed ST elevation and depression. There is inferior T-wave inversion and the upright right precordial T-waves are indicative of reperfusion to the posterior wall as well.  There is an infero-posterior STEMI of unknown age.   

It appears that the Q-waves were well formed at the time of presentation.
--Do inferior Q-waves appear immediately after the onset of a STEMI?  No.  [However, anterior Q-waves (QR-waves) can be present in the first hour after onset of anterior STEMI)].  
--The inverted T-waves also argue against an acute and persistently occluded artery.

Therefore, this patient's MI was subacute.  

Now, what do you think the diagnosis is?


Posterior STEMI puts patients at risk of papillary muscle infarction and rupture. (The posterior leaflet is supplied by posterior branches off the RCA and is vulnerable, whereas the anterior leaflet has its blood supply from the LAD and circumflex) An infarct in the last several days or one week is consistent with acute papillary muscle rupture.  This patient's presentation is classic for acute severe mitral regurgitation.
1. Acute pulmonary edema
2. Hyperdynamic heart (very low afterload out towards the left atrium and pulmonary veins
3. Severe pulmonary edema without hypertension.
4. Evidence of subacute inferoposterior MI (most occur more than 24 hours from onset of MI)
5. Absence of murmur because in acute rupture, the left atrium is small and as the LV contracts, the pressure between the LV and LA rapidly equalize so that  there is no lengthy period of turbulence.

An echo with Doppler was the diagnostic study, and confirmed papillary muscle rupture.  She was given immediate afterload reduction with nitroprusside, and taken for an angiogram which showed 2-vessel disease and a 90% RCA (the culprit) with flow.  Balloon pump was placed and she was taken for immediate valve replacement and CABG and did well.

The initial troponin was 2.4 ng/ml (probably still elevated from the MI one week ago), but did rise to 19 ng/ml by the next morning.  After CABG, it rose to 50 ng/ml.


Saturday, March 23, 2013

Wide Complex Tachycardia

An otherwise healthy woman in her 20's presented with tachycardia.  She had experienced palpitations and called 911.  Prehospital rhythm strips were at a rate of at least 200 (unavailable) and the medics gave adenosine at both 6 mg and 12 mg with no effect.  She was very stable with no CP, SOB, hypotension or evidence of shock.

Here is the initial ED ECG:
What is the diagnosis (this is pathognomonic)?  See below. 
(Notice that the computer incorrectly read ***Acute MI***)


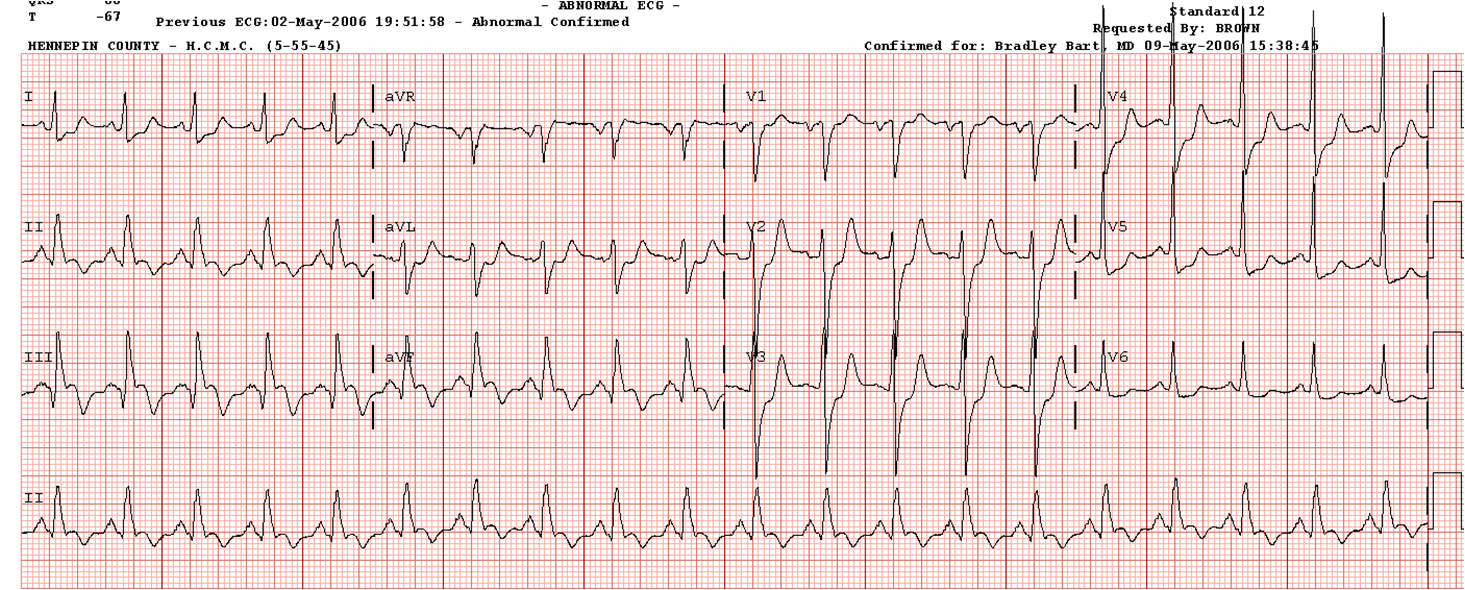
1. The rhythm is irregularly irregular, therefore it is atrial fibrillation
2. The complexes are wide (so one might think of atrial fibrillation with aberrancy, in which case you should see RBBB or LBBB pattern, which is not there)
3. It is very fast (200 bpm)
4. The shortest R-R interval (between complexes 12 and 13) is about 240 ms (very short)
5. The complexes look bizarre and are not uniform, as they would be with simple aberrancy.  Thus, these represent differentially pre-excited ventricular myocardium.

This is atrial fibrillation in the setting of WPW, and is a dangerous rhythm which can degenerate into ventricular fibrillation.  It is more likely to degenerate if the physicians gives AV nodal blocking drugs, especially calcium channel blockers.

Here is another example of this.

How should this be managed?  It can be managed with medications that convert atrial fibrillation to sinus, such as procainamide or ibutilide (and others), but when you have a wide complex very fast tachycardia, it is best to use electrical cardioversion.  It is the safest, and keeps you from having to make a definite diagnosis.   As long as you can manage procedural sedation, which is very easy in the case of cardioversion because you only need seconds of sedation and amnesia, then cardioversion is the safest method.

The pattern was not recognized as pre-excitation, but as atrial fib with aberrancy.  These were very smart and very experienced physicians, but anyone can make a snap judgment followed by premature closure, and this is another reason why electricity is the safest - you don't need to have the correct diagnosis).  Subsequently, the physicians gave the patient first diltiazem and then esmolol, with no ill effect but also little beneficial effect.  It could have resulted in degeneration to ventricular fibrillation.  AV nodal blockade is particularly dangerous when there is a shortest R-R interval of less than 250 ms (as here), and especially if less than 220 ms.  Adenosine is also contraindicated. 


After dialing up the esmolol, the patient spontaneously converted to NSR and had the following ECG:


After conversion:
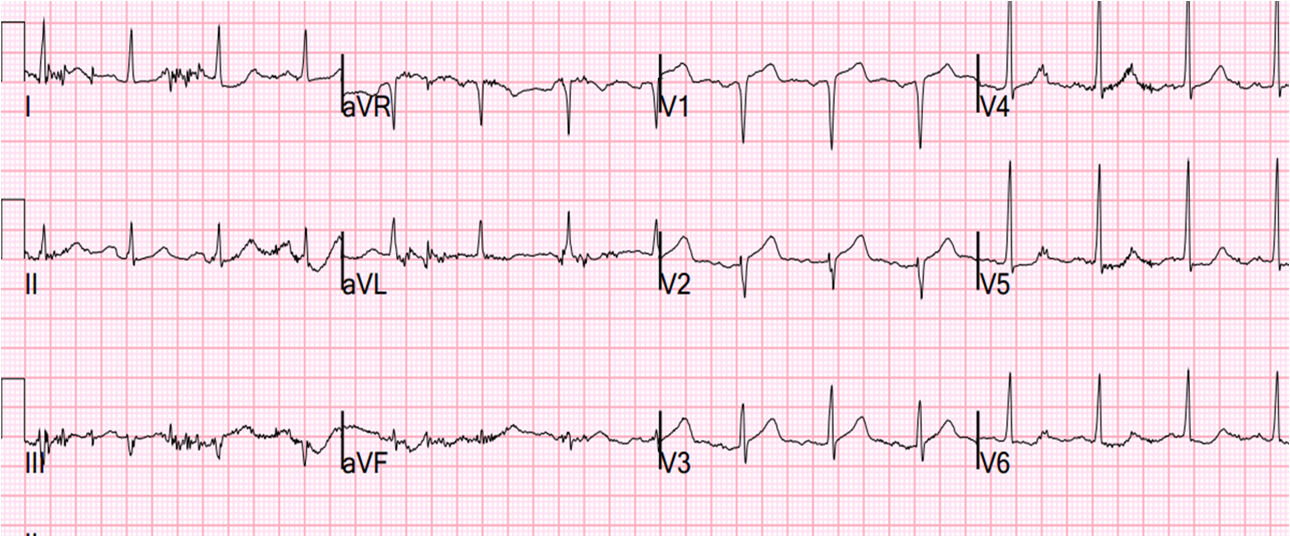
Sinus rhythm with short PR interval and large delta waves seen best in precordial leads, and confirming Wolff Parkinson White (WPW) syndrome of pre-excitation down an accessory pathway.  There can be positive, negative, or isoelectric delta waves depending on their own axis.  WPW may greatly change both depolarization (in this case with large upright R-waves in right precordial leads because the accessory pathway is left lateral, depolarizing the ventricle from left to right) and repolarization (see these cases for acute MI mimics due to WPW)


Followup, and what is "Concealed Conduction"?

Her charts revealed 3 previous visits for palpitations, and in all cases the ECG was interpreted as normal.  Here is one of them:
There are very subtle delta waves which I do not believe I would have noticed propectively, but in retrospect look to be real.  The computer read a QRS duration of 106 ms which is borderline long and due to these subtle delta waves.  The PR interval is normal because the delta waves are so minimal.


This is concealed conduction, or nearly concealed.  That is to say, the presence of an accessory pathway is not evident (at least to most observers) on the baseline surface ECG.  (There are times when it is truly concealed, and there are no delta waves even in retrospect).  It is important to know about concealed conduction so that if you suspect WPW as a cause of tachycardia that is now resolved, you will not rule out the diagnosis by a normal baseline ECG.

There are two mechanisms of concealed conduction:

1. Conduction through the accessory pathway is retrograde only (mechanism unclear)
2. The impulse reaches the AV node and gets through to the ventricles before it gets to, and through, the accessory pathway.

The second mechanism applies in this case: Look at the first two ECGs above (those with abnormal conduction). Notice that the R-wave in V1 is very large, as it would be in RBBB.  This is because the impulse is going down a left lateral bypass tract and then proceeding through the myocardium from left to right, resulting in a large R-wave in V1.  Thus, the bypass tract (accessory pathway) is to the left lateral of the left atrium, which is far from the sinus node (right part of right atrium).  When the AV node is conducting fast (such as with anxiety, low vagal tone, high catecholamines, etc.), then the impulse gets to and through the AV node and through the Purkinje system before it makes it down the accessory pathway and therefore there is no (or minimal) delta wave.  On the other hand, if the AV node conduction is slower, then the delta waves will  be evident.

However, even in WPW with concealed conduction, the accessory pathway is always available to cause trouble!  

In both types of concealed conduction, it can result in orthodromic reciprocating supraventricular tachycardia (re-entrant down through the AV node and up through the bypass tract), and this cannot be differentiated from intranodal reentrant (standard) SVT on the surface ECG.

In the second type of concealed conduction, it can result in three abnormal rhythms: First, there can be orthodromic re-entrant reciprocating tachycardia.  Second, there can also be antidromic re-entrant reciprocating tachycardia (which is a regular wide complex tachycardia). And third, if atrial fibrillation develops, then it will manifest as this dangerous wide complex tachycardia.

Why did she not have concealed conduction on the post conversion ECG?   --Because she had received AV nodal blockade with diltiazem and the pathway down the AV node was slow.

Wednesday, March 20, 2013

Septal STEMI with lateral ST depression, then has collateral reperfusion resulting in Wellens' waves

A middle-aged male presented with 1.5 hours of 8/10 chest pain associated with diaphoresis and vomiting.  He has a prior history of untreated hypertension and hyperlipidemia, and is a current smoker.


He called 911. Prehospital vitals were normal, and there was no change in pain with 2 sublingual NTG.  Here is his first ED ECG, at time zero. The preshospital ECG was identical and the computer in both cases read "nonspecific ST-T abnormalities."
Zero hours.  There is STE in V1 and V2, and ST depression in I, aVL, V5, and V6.  Is it normal variant STE?  Or is it anterior STEMI?  As in a recently posted case, ST depression in the lateral leads should not be seen in normal variant STE.  Because of this ST depression, STEMI should be diagnosed until proven otherwise, and the STE equation should not be used; if it were used, with STE60V3 = 2, QTc = 412ms, RAV4 = 20mm, the value would be 20.18 (less than 23.4 would indicate normal variant).  The equation is falsely negative because most of the ischemia is in the septum, not the anterior wall, so that STE in V3 is not high and R-wave amplitude in V4 is not affected.

In this case, there was a previous ECG to compare with (and the patient's last echocardiogram was totally normal as well)

Previous ECG had no ST elevation or depression.  This confirms that the STE is new ischemia and that this is STEMI.
The STEMI was not recognized, the patient was put on a nitroglycerine drip (as well as aspirin, heparin, and clopidogrel), and pain continued.  A subsequent ECG was recorded at 1 hour:
1 hour.  The T-waves in V1-V3 are inverting and in V4-V6 are flattening.  This is some evidence of reperfusion; is it Wellens'?

The ECG has the appearance of Wellens' waves, but the patient is not pain free, so it is not Wellens' syndrome.  Continued pain in the context of definite ischemia is an indication for urgent angiography and PCI.

The patient was still having pain after up-titration of nitro when this ECG was recorded at 2.5 hours after presentation:
2.5 hours.  Wellens' waves are evolving.
Rather than going urgently to the cath lab, an immediate echo was recorded, which showed moderately decreased LV function with an EF of 40%, and a new wall motion abnormality of the distal septum, anterior, and inferior walls, and apex.

The patient was taken for angiogram which showed total occlusion of a type III (wraparound) LAD at the takeoff of a large 1st diagonal.  However, the LAD was filling via left to left and right to left collaterals.  The LAD was opened and stented.

The troponin I peaked at 40 ng/ml.  The collateral circulation explains the Wellens' waves, but it did not fully restore perfusion and so the patient had continued pain.  Collateral circulation was likely fostered by nitroglycerine.

Here is the ECG after intervention

Full evolution of Wellen's waves to "type B" deep symmetrical waves.

Saturday, March 16, 2013

Massive Precordial ST Elevation. What is it?


This case comes from my book, The ECG in Acute MI:

A male in his 70’s had a cardiac arrest and was successfully defibrillated.  Below is a 12-lead ECG.    
What do you think of this ECG?  What do you think the angiogram showed? 

Due to the obvious ST elevation, he was given tPA (it was a small rural hospital) and the ST elevation quickly resolved.  The patient had bradycardia, heart block, and hypotension. He was intubated, externally paced, and started on pressors.  There was no pulmonary edema.  What is going on?  See below for answer.


This appears to be a right sided ECG, as the R-waves in I and aVL are not present in V5 and V6 (sorry, I don't have the left sided one).

There is an S-wave in lead I and very large R-waves in V1R to V3R.  As there is an rSR' in precordial leads, is this right bundle branch block?  This is a bit uncertain because lead I appears to have normal QRS duration, but V4R to V6R appear wide.  In any case, is there right  ventricular hypertrophy?  It is difficult to make a diagnosis of right ventricular hypertrophy in the presence of RBBB because both cause an S-wave in lead I and a large R'-wave in V1.  However, in this case the R'-wave in V1-V3 is far larger than with a normal RBBB.  In any case, the R' wave is very large, diagnostic of RV hypertrophy.

ST elevation: There is ST elevation in II, III, aVF with reciprocal ST depression in aVL (inferior STEMI), and ST elevation from V1R to V6R (right ventricular STEMI).  Angiogram showed subtotal occlusion of proximal RCA.  Wedge pressure was 18 (low for a patient in cardiogenic shock).  Echocardiogram showed severe RV hypertrophy with very poor RV function and good LV function but poor LV filling pressures.  It was later discovered that the patient had a history of pulmonary fibrosis and pumonary hypertension.  ST elevation was due to right ventricular STEMI in the setting of severe right ventricular hypertrophy.

Wednesday, March 13, 2013

Septal STEMI with ST elevation in V1 and V4R, and reciprocal ST depression in V5, V6

This was sent to me by a reader named Aaron.

A 36 yo male smoker presented to the ED with chest pain.  It had started the night before as "indigestion" and had progressed to 8/10 substernal chest pressure radiating to the right shoulder/jaw associated with diaphoresis, nausea, and SOB.

Here is a 15 lead ECG:

Sinus rhythm.  There is ST elevation in V1 (of 3.0 mm at the J-point), V2, aVR (1 mm, no matter how it's measured), and V4R (1.5 mm at J-point, 2.5 at 60 ms after the J-point), and very subtly in lead III.  There is reciprocal ST depression in I, II, aVL and V4-V6, as well as some very subtle STD in posterior leads V8 and V9 (which also have very low QRS voltage)
Here is his initial ECG, which the tech recorded as a 15-lead ECG (the doctors were not sure why):


Thus, there is a rightward, anterior, and slightly superior ST axis.

Here is a map of leads V1, V2, and V4R.  This is traced off a an actual MRI.


I did not label V8 and V9, but they would be on your left behind the lung.  You can see how V1, V2, aVR, and V4R would have ST elevation in either a right ventricular STEMI or with a septal STEMI, and how lateral leads, and even posterior leads, would have reciprocal ST depression.


The combination of precordial ST elevation and ST depression, simultaneously, should alert you to LAD occlusion.  This is frequently seen when there is LV septal involvement.  STE in V4R is confirmatory evidence.   In my early repolarization/anterior STEMI study, I excluded any ECG with any precordial ST depression, considering this to be diagnostic of STEMI because normal variant precordial ST elevation does not coexist with simultaneous precordial ST depression.
  
In this case, the emergency physicians were somewhat puzzled, and the interventionalist was highly skeptical, but took the patient to the cath lab and found an occluded LAD.   It is possible that there was also RV involvement - see explanation below.     


Here is another similar case.


In a 1999 study by Engelen et al. of patients with anterior STEMI, ST elevation of greater than or equal to 3.0 mm in lead V1 was 100% specific (but only 12% sensitive) for septal STEMI.  Smaller degrees of STE in V1 were not nearly as specific.  See more on STE in aVR in anterior STEMI, below.


STE in V4R
Interestingly, here is a paper (published as a letter) describing the results of recordings of V4R in 117 consecutive LAD occlusions and showed that this was associated with septal involvement and also higher risk.

In this study, 39 (33%) had STE of at least 1 mm (at 80 ms after the J-point) in V4R.There were no significant differences between the groups regarding indexes of infarct size.  None of the patients with STE in lead V4R had echocardiographic evidence of right ventricular dysfunction or dilated right ventricles.  Only the middle anteroseptal segmental wall motion abnormality was significantly and independently associated with STE in lead V4R. The odds ratio for akinesis (or more severe motion abnormality) was 6.1 (p = 0.036) and for hypokinesis (or more severe motion abnormality) was 12.0 (p = 0.033).  Patients with STE in V4R were more likely to experience the combined end point of primary VF, acute HF, or death (54% vs. 18%) and were also more likely to experience primary VF (21% vs. 2.5%)  and acute HF (39% vs. 17%). In multivariate analysis, STE in lead V4R on admission electrocardiography remained a strong independent variable associated with acute HF and the combined end point of primary VF, acute HF, or death during hospitalization. 

What does ST depression in V5 and V6 signify
This paper addresses this for inferior STEMI, but is relevant here also, I think because it shows how V5, and V6 are reciprocal to V4R, and ST elevation on one side will lead to ST depression on the other:
http://www.cinc.org/Proceedings/2005/pdf/0651.pdf.   In this study of RV MI associated with inferior STEMI, ST depression in V5, V6 had 46% sensitivity and 96% specificity for proximal RCA occlusion.  Sensitivity increased to 58% with a small drop in specificity if STE in V4R was added.   Why are V4R and V5, V6 so insensitive for proximal RCA occlusion?  Would this not always cause RV infarction?  In fact, no.  This is because, in many patients, the RV is supplied by both the LAD and the RCA.  Therefore, the RV is often protected from RCA occlusion by the LAD.  Conversely, LAD occlusion could possibly lead to RV infarct if it is not adequately supplied by the RCA.  Autopsy studies in the '80s by HR Andersen showed this: JACC 1987l10:1223-32 and Br Heart J 1989;61:514-20.  This study used MRI to show the LAD supply to the RV.


How about STE in aVR?
Below is from a quote from part of a piece on aVR which I wrote for Current Emergency and Hospital Medical Reports: "Updates on the electrocardiogram in Acute Coronary Syndromes." DOI 10.1007/s40138-012-0003-1, published online Dec. 23, 2012.

STE in aVR in STEMI 
Not NonSTEMI: STE in aVR during left main ACS is usually NonSTEMI (no occlusion). 

"Approximately 10% of patients with anterior STEMI have STE of at least 1 mm in aVR (as measured at 60 ms after the J-point),(Wong, 2012) and 25% have at least 0.5 mm STE in aVR (as measured at 60 ms after the J-point, relative to the TP segment).(Aygul, 2008)  STE or STD of 1 mm or more in anterior STEMI portended a worse prognosis (compared to no STE or STD), even after correcting for STE or STD elsewhere on the ECG, but only ST depression in aVR (“reciprocal to injury in the area of lead V7”) remains significant when corrected for all other ECG and clinical factors.(Wong, 2012)  STE in aVR of at least 0.5 mm in anterior STEMI predicts septal AMI (occlusion of the LAD proximal to the first septal perforator) with a PPV and NPV of 70% and 80%(Aygul, 2008) better than STE in V1, which at a cutoff of greater than or equal to 2.5 mm had 12% sensitivity and 100% specificity, with PPV and NPV of 100% and 39%.(Engelen, 1999)   Kotoku et al. (2009) similarly found that STE in aVR correlated with proximal (vs. distal) LAD occlusion and was negatively correlated with a long (vs. short), or wraparound, LAD that affected the inferior wall.  This is intuitive, as a proximal occlusion would lead to basal wall STEMI (see below), and distal occlusion of a wraparound (long, “type III”) LAD would lead to inferior STE which would reciprocally attenuate the STE in aVR, or lead to STD in aVR.  To be complete, Wong also found that STE in aVR in inferior STEMI conferred worse outcomes.(Wong, 2012)"


1.            Wong CK, Gao W, Stewart RA, French JK, Aylward PE, White HD. The prognostic meaning of the full spectrum of aVR ST-segment changes in acute myocardial infarction. Eur Heart J 2012;33(3):384-92.
2.            Aygul N, Ozdemir K, Tokac M, et al. Value of lead aVR in predicting acute occlusion of proximal left anterior descending coronary artery and in-hospital outcome in ST-elevation myocardial infarction: an electrocardiographic predictor of poor prognosis. J Electrocardiol 2008;41(4):335-41.
3.            Engelen DJ, Gorgels AP, Cheriex EC, et al. Value of the electrocardiogram in localizing the occlusion site in the left anterior descending coronary artery in acute myocardial infarction. J Am Coll Cardiol 1999;34(2):389-95.
4.            Kotoku M, Tamura A, Abe Y, Kadota J. Determinants of ST-segment level in lead aVR in anterior wall acute myocardial infarction with ST-segment elevation. J Electrocardiol 2009;42(2):112-7.


Saturday, March 9, 2013

First ED ECG is Wellens' (pain free). What do you think the prehospital ECG showed (with pain)?

This male in his 40's had been having intermittent chest pain for one week.  He awoke from sleep with crushing central chest pain and called ems.  EMS recorded a 12-lead, then gave 2 sublingual nitros with complete relief of pain.  He arrived in the ED and had this ECG recorded:
There are Wellens' waves, type A (upsloping ST segment then inversion of the terminal part of the T-wave - terminal T-wave inversion, or biphasic T-waves) in V2-V4, and aVL.  Type B waves are deeper and symmetric.

When the patient had chest pain, prior to nitroglycerine, what do you think the ECG showed?  See below.


Here is the prehospital ECG, with pain:


Hyperacute anterolateral STEMI

The medics had activated the cath lab and the patient went for angiogram and had a 95% stenotic LAD with TIMI-3 flow.  A stent was placed.

Here is the 3 hour post angio ECG:


The Wellens' waves are receding (this is unusual)
 

The next AM, another ECG was recorded:
The Wellens' waves are still present, and not evolving
 A transthoracic echo done next day was entirely normal.  The peak troponin I was 0.364 ng/ml.

The reperfusion was so early that wall motion recovered completely and early.  

For those who depend on echocardiogram to confirm the ECG findings of ischemia, this should be sobering.  I have seen cases of Wellens' syndrome that were ignored because of either negative troponins or normal echo or both and the patient did not get an angiogram and had a bad outcome.

Wellen's syndrome is a Reperfusion syndrome.  All of Wellens' cases in his studies (1, 2) had all of:
1) preserved R-waves
2) resolution of pain
3) restored flow to the anterior wall through either
     a) an open artery or
     b) collateral circulation.

This is a rare case in which we can prove that the Wellens' waves represent spontaneous reperfusion because we recorded a prehospital ECG during pain.  Such a mechanism is supported by the work of Doevendans (3) and Wehrens (4), who both described terminal T-wave inversion (which have the same morphology as Wellens' waves) as the earliest sign of reperfusion from reperfusion therapy.  (I don't know that this connection has ever been formally written about in any original literature, though I have long maintained that this is the pathophysiology of Wellens' waves.)

In my experience, all Wellens' with significant myocardial infarction have evolution from type A waves to type B waves over 6-24 hours' time, so that the presence of type A or type B waves, I believe, are simply a matter of the timing of recording and the rapidity of evolution.  In this case, the duration of ischemia was so brief that there was no such evolution, and there was near-normalization.  When there is extremely brief ischemia, as in this case, or this case, it may entirely reverse, especially in unstable angina (negative troponins).


Lessons:
1. Wellens' syndrome represents a state of reperfusion of the infarct related artery
2. Ischemia may be so brief that Wellens' waves do not evolve
3. Ischemia may be so brief that troponins are borderline or normal
4. Ischemia may be so brief that wall motion normalizes (though presence of wall motion abnormality would have a very high positive predictive value for confirming the ECG findings.).


1. de Zwaan C., Bar F.W., Janssen J.H.A., et al. Angiographic and clinical characteristics of patients with unstable angina showing an ECG pattern indicating critical narrowing of the proximal LAD coronary artery. Am Heart J (1989) 117 : pp 657-665.
  2. de Zwaan C., Bar F.W., Wellens H.J.J., Characteristic electrocardiographic pattern indicating a critical stenosis high in left anterior descending coronary artery in patients admitted because of impending myocardial infarction. Am Heart J (1982) 103 : pp 730-736.   3. Doevendans P.A., Gorgels A.P., van der Zee R., et al. Electrocardiographic diagnosis of reperfusion during thrombolytic therapy in acute myocardial infarction. Am J Cardiol (1995) 75 : pp 1206-1210.

4. Wehrens X.H., Doevendans P.A., Ophuis T.J., et al. A comparison of electrocardiographic changes during reperfusion of acute myocardial infarction by thrombolysis or percutaneous transluminal coronary angioplasty. Am Heart J (2000) 139 : pp 430-436.

Recommended Resources